Town of Watertown
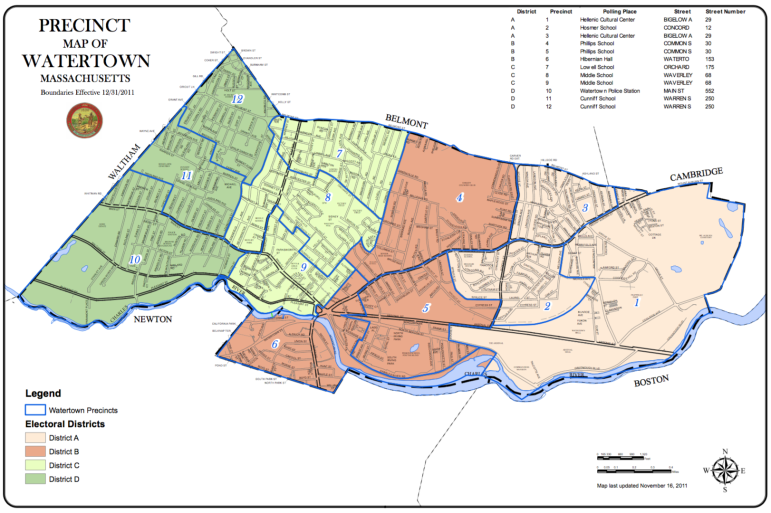
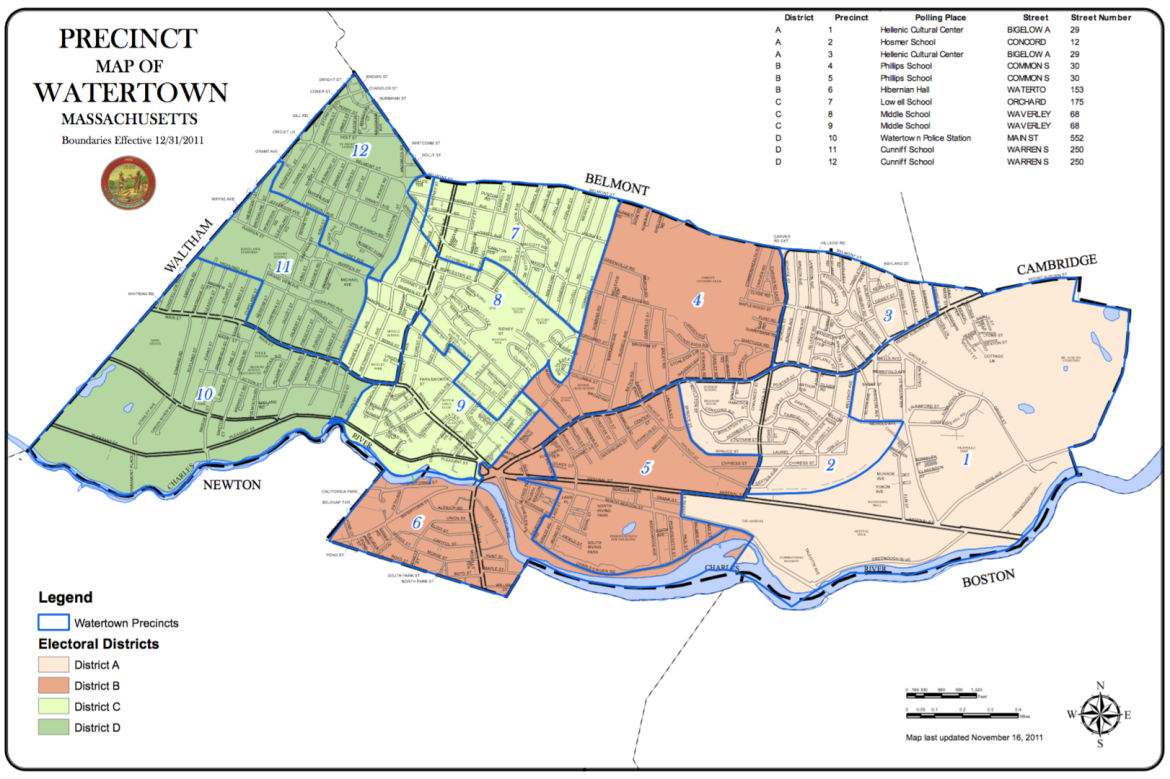
A map of Watertown’s Districts: Peach is A, Red is B, Lime Green is C, Green is D.
Leanne Hammonds won the race for Library Trustees by more than 500 votes, and got a lot of help from two precincts. See how each of the four candidates fared in each precinct.
With 2,536 votes, Hammonds won all 12 precincts in Watertown and got more than 300 votes in precinct 7 and 8 and won the precincts by 90 and 46 votes respectively.
Second place finisher Michael Hanlon narrowly beat Daniel Pritchard, who won the third and final spot. Hanlon did better than Pritchard in eight precincts (1, 2, 6, 7, 9, 10, 11 and 12) while Pritchard was ahead in four, precincts 3, 4, 5, and 8.
Fourth place finisher Davide Breakstone had good showing in a few precincts. In precincts 4 and 8 he got the second most votes. He got 259 votes in 4, just 15 fewer than Hammonds, and received 264 votes in 8. In 5 and 6 Breakstone finished third, ahead of Hanlon in 5 and above Pritchard in 6.
Library Trustee Race Precinct by Precinct
| Precinct | Hammonds | Pritchard | Hanlon | Breakstone |
| 1 | 122 | 88 | 116 | 69 |
| 2 | 165 | 146 | 150 | 101 |
| 3 | 217 | 202 | 151 | 125 |
| 4 | 274 | 226 | 196 | 259 |
| 5 | 207 | 182 | 163 | 176 |
| 6 | 166 | 99 | 145 | 126 |
| 7 | 308 | 213 | 218 | 173 |
| 8 | 313 | 232 | 215 | 264 |
| 9 | 158 | 121 | 132 | 111 |
| 10 | 236 | 188 | 231 | 124 |
| 11 | 188 | 141 | 145 | 122 |
| 12 | 182 | 109 | 132 | 88 |
| total | 2536 | 1947 | 1994 | 1738 |
Voter Turnout
The total turnout in Tuesday’s election was lower than the previous two Town Elections. Some precincts had more than a quarter of voters cast ballots, while less than one-in-six voters came out in others.
This year the total turnout was 4,758, or 20.23 percent. In 2015, the turnout was 4,585 (20.48 percent) and in 2013 4,780 Watertown residents voted, 21.26 percent.
Precinct 7 had the highest voter turnout by number – 563 – and turnout rate – with 27.34 percent of registered voters casting ballots. Close behind was precinct 8 where 543 residents voter, for a 26.6 percent turnout. Precinct 4 had 534 residents vote, for a turnout of 26.5 percent.
On the flip side, only 233 voters – 13.2 percent – cast ballots in precinct 1. Precinct 9 had a 15.72 percent turnout, with 281 ballots cast. Precinct 2 had 311 ballots cast (16.31 percent) and precinct 6 had 319 residents vote (16.91 percent).
Voter Turnout by Precinct
| Precinct | Registered Voters | Ballots Cast | Precinct Turnout |
| 1 | 1,763 | 233 | 13.20% |
| 2 | 1,907 | 311 | 16.31% |
| 3 | 1,971 | 374 | 18.98% |
| 4 | 2,015 | 534 | 26.50% |
| 5 | 1,934 | 412 | 21.30% |
| 6 | 1,886 | 319 | 16.91% |
| 7 | 2,059 | 563 | 27.34% |
| 8 | 2,041 | 543 | 26.60% |
| 9 | 1,787 | 281 | 15.72% |
| 10 | 2,553 | 520 | 20.37% |
| 11 | 1,819 | 341 | 18.75% |
| 12 | 1,786 | 327 | 18.31% |
| total | 23,521 | 4,758 | 20.23% |

Why couldn’t we just align these elections to even numbered years when folks are more tuned in and more likely to turn out?
Under state law, city elections are held in odd-numbered years, and state & federal elections are held in even-numbered years.